| Sample ID: | Sample_1445 |
| Biosample name: | Adipose |
| Biosample type: | Tissue |
| Tissue type: | Adipose |
| Cancer type: | Other |
| Region number: | 13687 |
| Length: | 7682.488 kb |
| GEO/SRA ID: | SRR8255928 |
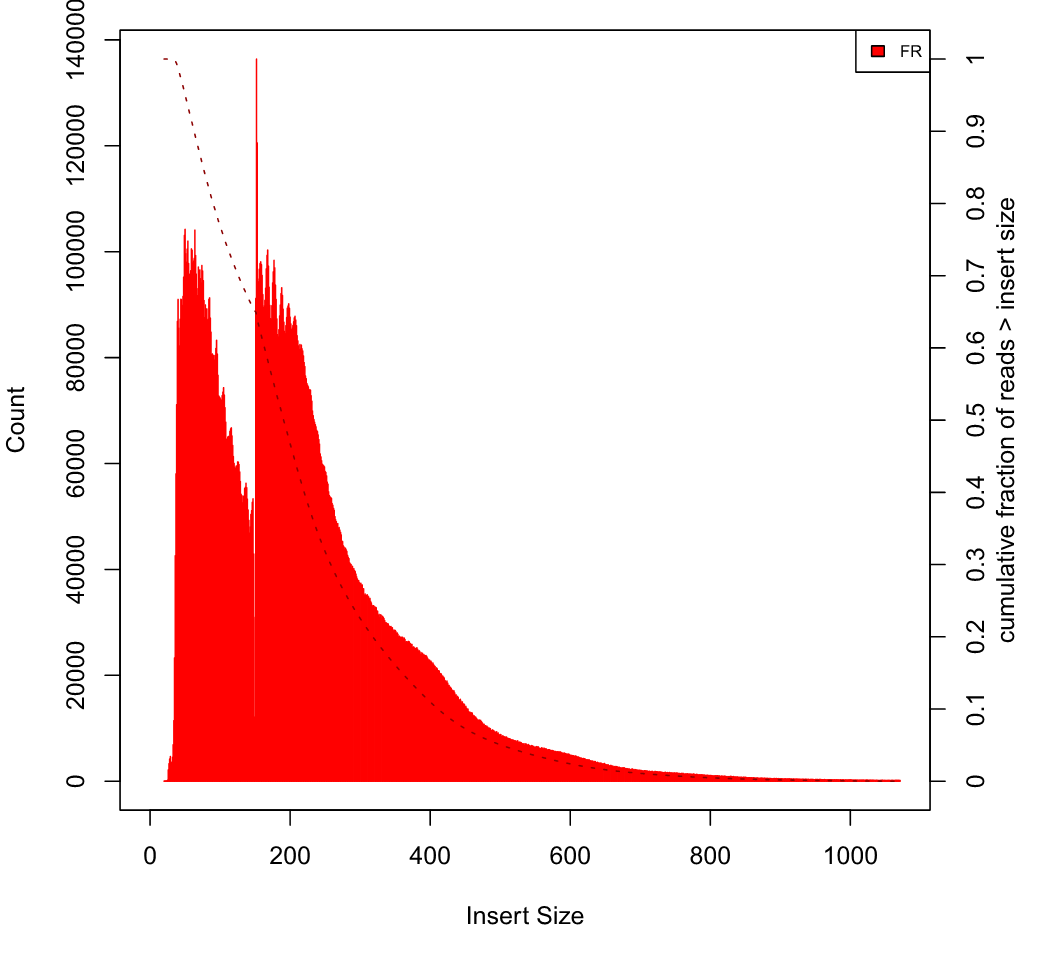
| Mean insert size: | 218.134 |
| Standard deviation: | 145.957 |
| TSS enrichment score: | 16.98690 |
| FRiP: | 0.02733 |
| Diasgnostic plot | |
 |
|


| Plot A: a pie chart of annotated genomic features. |
| Note A: the proportion of annotating genomic region (Promoter, 5'UTR, 3'UTR, Exon, Intron, Downstream and Intergenic). |
| Plot B: a heatmap of peaks binding to TSS region. |
| Note B: the profile of ATAC peaks binding to TSS region (+/- 1kb). |
| Read mapping: | bowtie2(v2.2.5) -p 10 -X 2000 -x -S |
| Duplicates Removing: | picard MarkDuplicates REMOVE_DUPLICATES=true ASSUME_SORTED=true |
| Peak calling: | macs2(2.1.2) --broad--SPMR --nomodel --extsize 200 -q 0.01 |
| Trimming the adapter: | trim_galore --phred33 --stringency 3 --length 20 |