| Sample ID: | Sample_0901 |
| Biosample name: | B cell |
| Biosample type: | Primary Cell |
| Tissue type: | Lymphoblastoid |
| Cancer type: | Epstein-Barr Virus (EBV) |
| Region number: | 18629 |
| Length: | 9370.678 kb |
| GEO/SRA ID: | SRR5826005 |
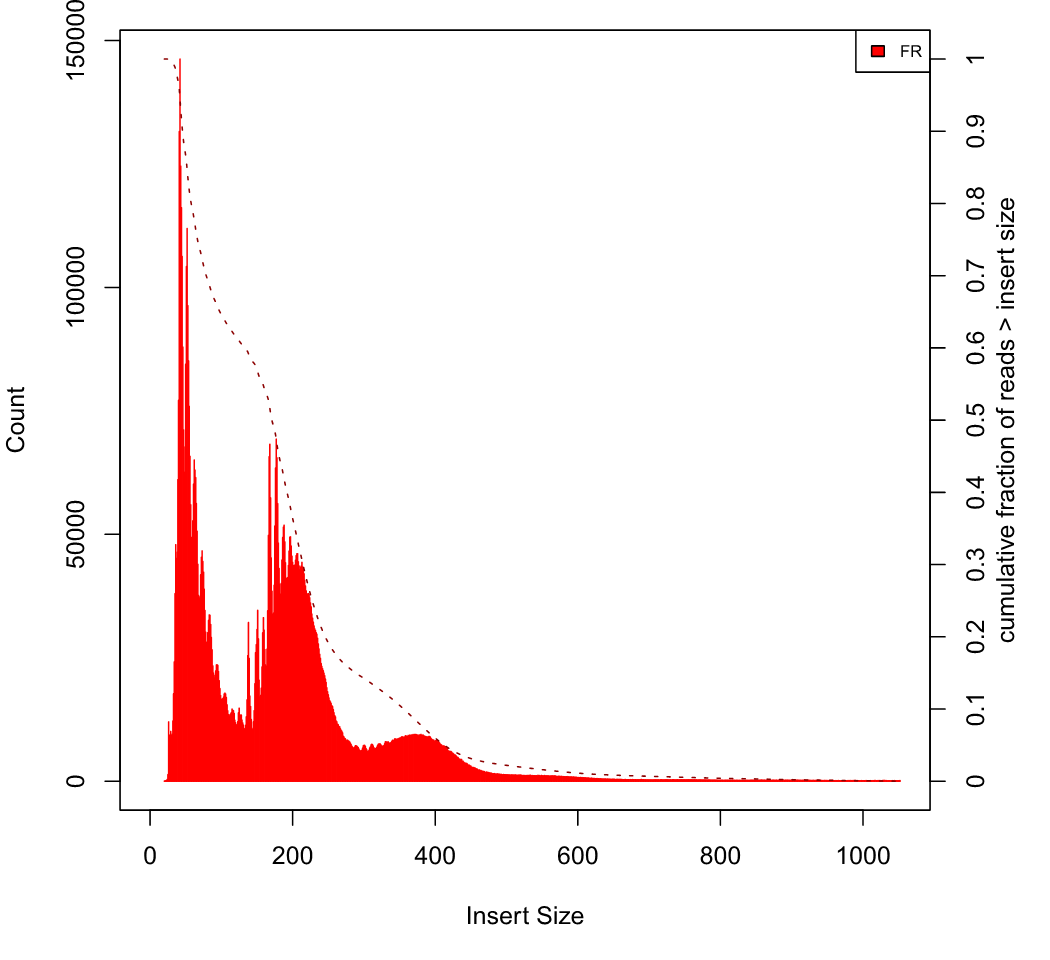
| Mean insert size: | 177.817 |
| Standard deviation: | 129.906 |
| TSS enrichment score: | 12.68060 |
| FRiP: | 0.12587 |
| Diasgnostic plot | |
 |
|


| Plot A: a pie chart of annotated genomic features. |
| Note A: the proportion of annotating genomic region (Promoter, 5'UTR, 3'UTR, Exon, Intron, Downstream and Intergenic). |
| Plot B: a heatmap of peaks binding to TSS region. |
| Note B: the profile of ATAC peaks binding to TSS region (+/- 1kb). |
| Read mapping: | bowtie2(v2.2.5) -p 10 -X 2000 -x -S |
| Duplicates Removing: | picard MarkDuplicates REMOVE_DUPLICATES=true ASSUME_SORTED=true |
| Peak calling: | macs2(2.1.2) --broad--SPMR --nomodel --extsize 200 -q 0.01 |
| Trimming the adapter: | trim_galore --phred33 --stringency 3 --length 20 |