The user-friendly interface was provided to search, browse, download and visualize the detailed information.

i. Get the accurate location information of the publications (e.g. the figures, text description of location information or SNP loci).
ii. Follow up the cited experimental procedure publications.
iii. The reference genome version was obtained directly according to the data provided in the publications.
i. The screen resolution is unified and resized the images in the publication as 300%.
ii. The screen pixel values obtained by manual measurement are A, B from the transcription start site respectively. A free software for screen pixel was used to measure the pixel values of A, B and P (http://www.ucbug.com/soft/113483.html).
iii. We obtained the start site of target genes from NCBI, and converted the corresponding version of location information by LiftOver in the UCSC browser, then, the formulas (1) and (2) were used to calculate the enhancer region.
The start position of enhancer = the start site of target gene ± (A+W/2)/P*xxxb (1)
The end position of enhancer = the start site of target gene ± (B-W/2)/P*xxxb (2)
The '±' represents downstream or upstream in the start site of target gene.
iv. The region of enhancer is converted into hg19 or mm10 version by LiftOver.
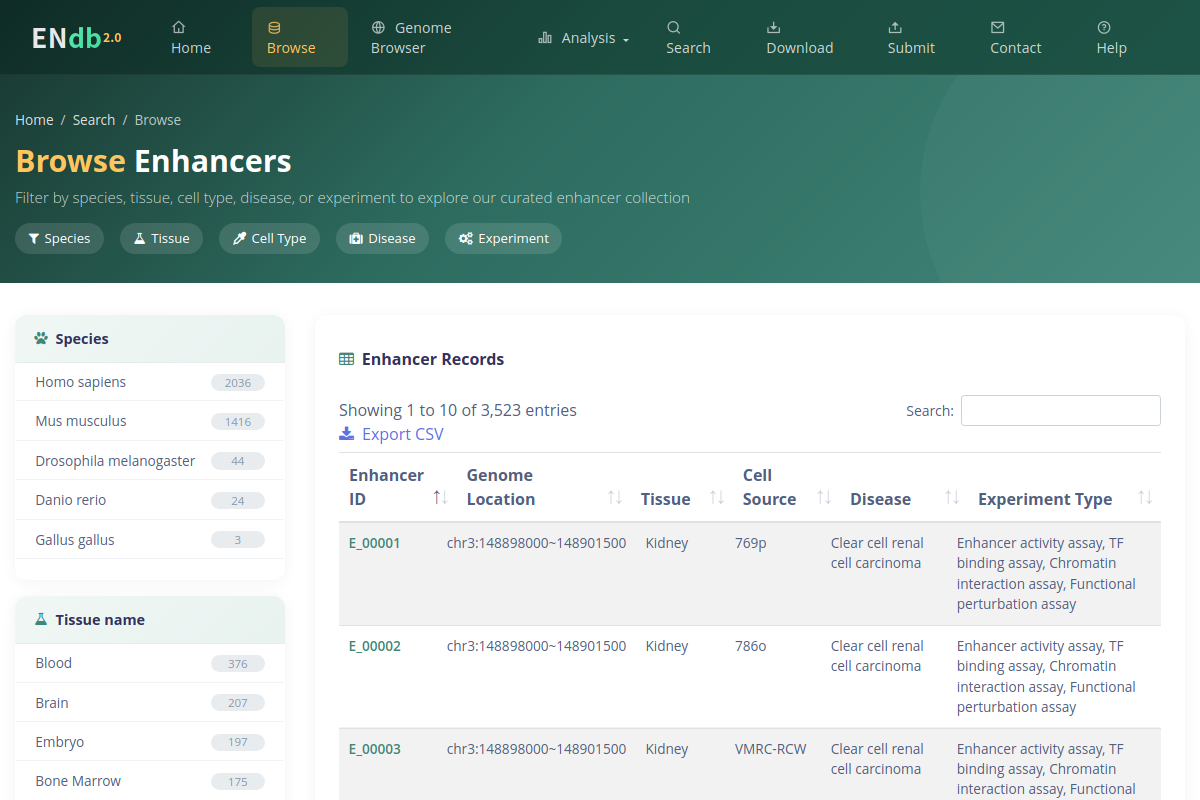
The Browse page presents enhancer records in an interactive, sortable table with dynamic sidebar filters. Users can filter by Species, Tissue, Cell Type, Disease, and Experiment — each with real-time result counts and pagination. Clicking any filter value refreshes both the sidebar statistics and the main table. Each record links to a detailed enhancer view.
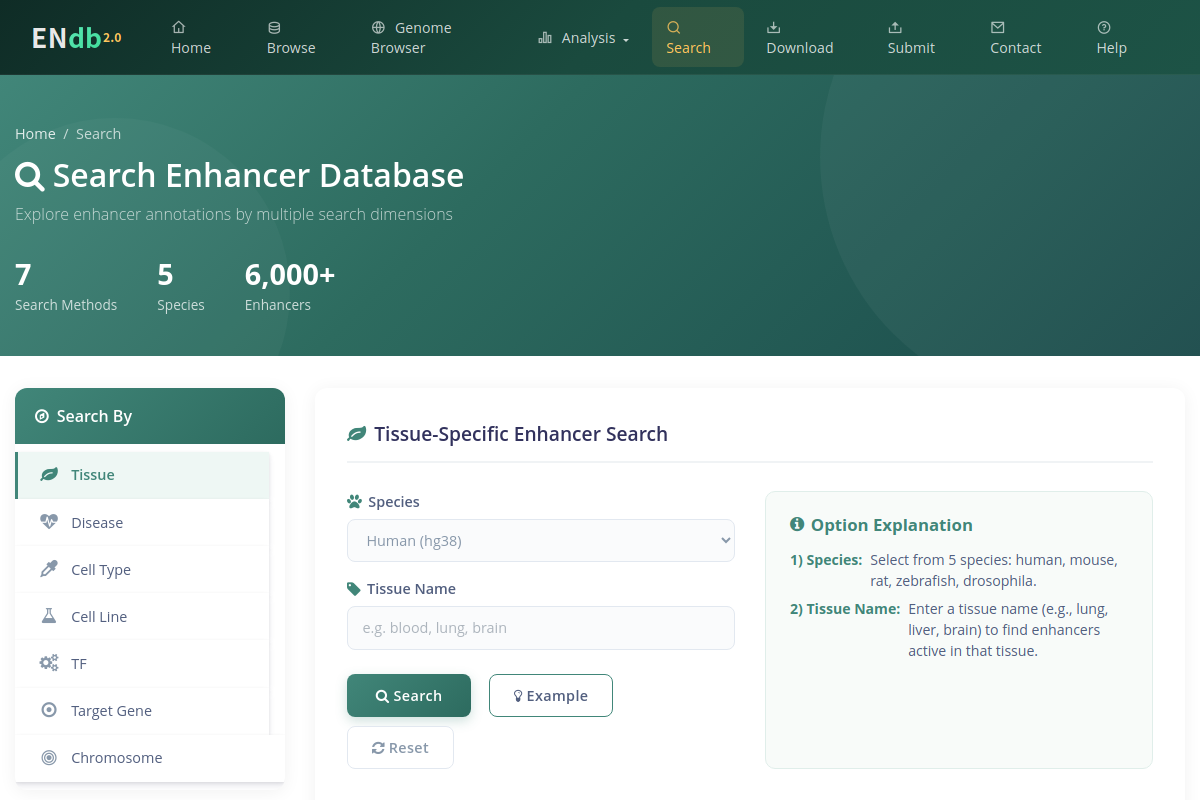
The Search page offers multiple search modes: by Enhancer, Target Gene, TF, Tissue, Cell Type, Cell Line, Disease, and Chromosome Region. Users can also upload a BED file for batch queries. Each mode includes example links and species selection (Human/Mouse). Results are displayed in a sortable DataTable with CSV export support.
Enhancer Details
Clicking the Details link opens a comprehensive enhancer page showing: basic metadata, target genes with aliases, transcription factors, regulatory state, upstream pathway annotations, an interactive Enhancer Associated Network graph, Overlapping Enhancers table and network, and gene expression charts across multiple datasets (ENCODE, GTEx, CCLE, TCGA). External links to the ENdb Genome Browser (JBrowse2) and UCSC Genome Browser are provided for each locus, dynamically matching the sample's genome build.

The Genome Browser integrates JBrowse2 to visualize enhancer annotations in their genomic context. Four genome assemblies are supported: Human hg38, Human hg19, Mouse mm10, and Mouse mm39. Tracks include reference sequence, gene annotations, experimentally validated enhancers, DNase-seq peaks, and super-enhancer elements. Users can switch assemblies with a single click and explore tracks interactively.

The Analysis module provides two tools:
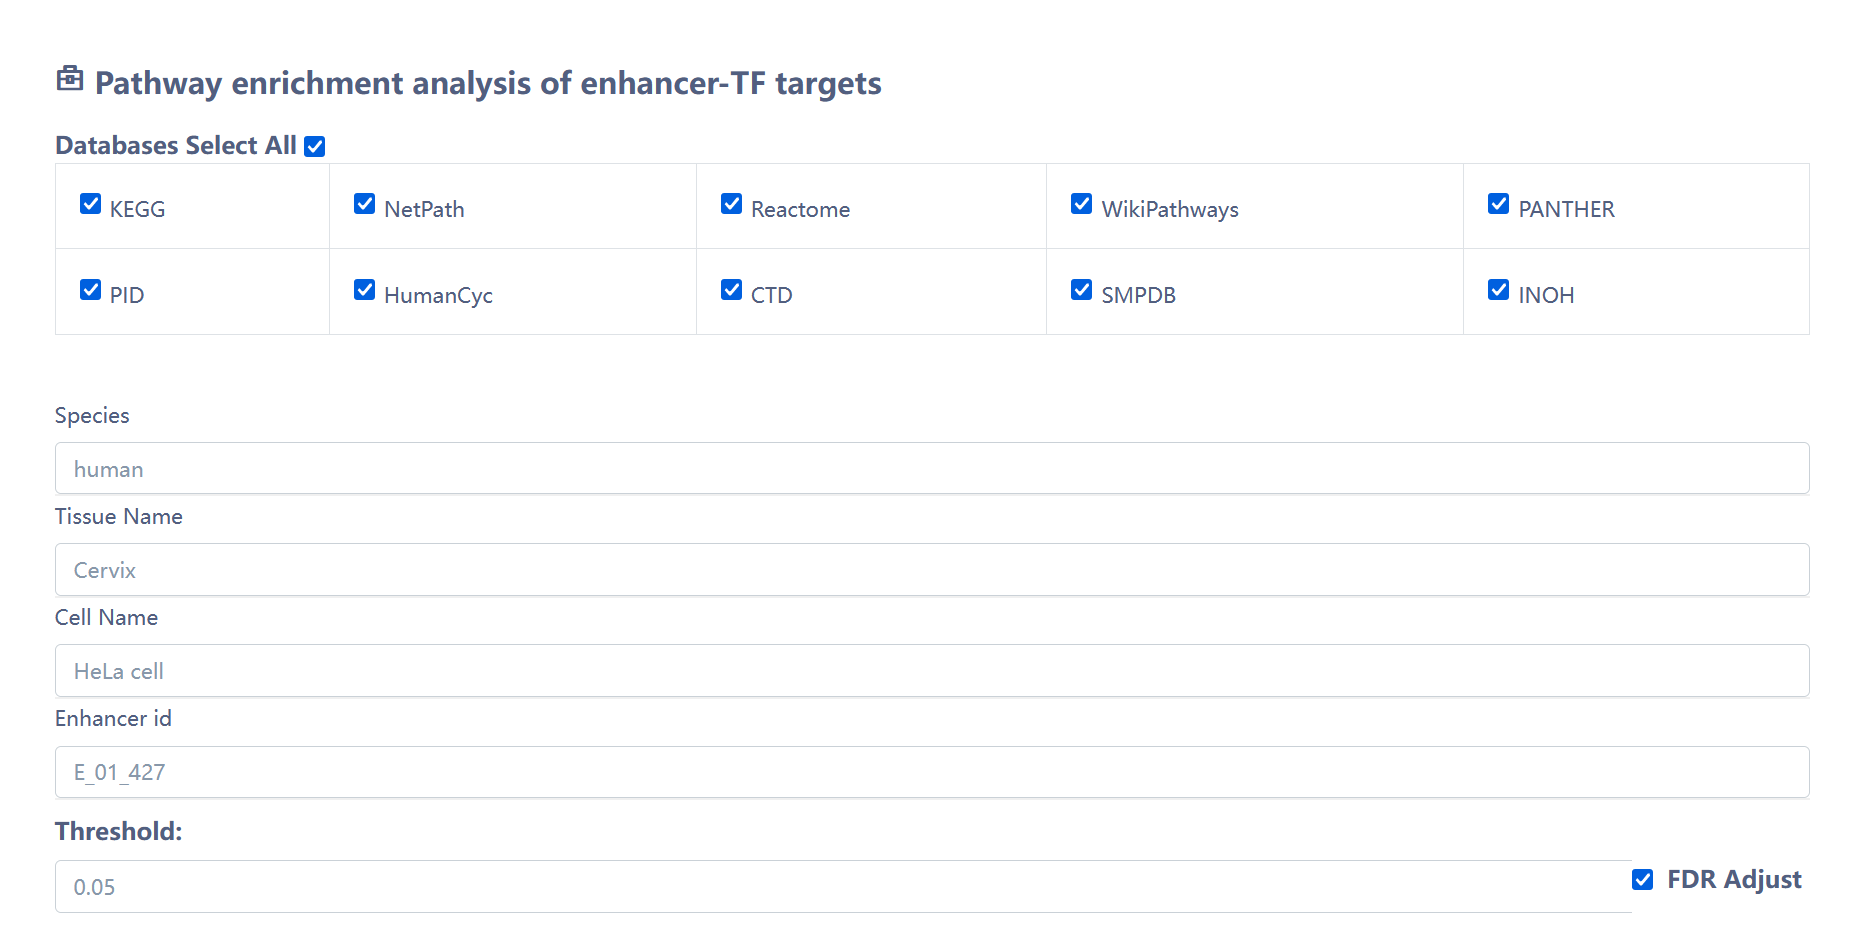
- Pathway Enrichment Analysis — Performs pathway enrichment on enhancer-associated TF target genes. Filter by Species, Tissue, Cell Type, and Enhancer ID using dynamic type-ahead search boxes. Supports 10 pathway databases (KEGG, Reactome, WikiPathways, PANTHER, PID, HumanCyc, CTD, SMPDB, INOH, NetPath).
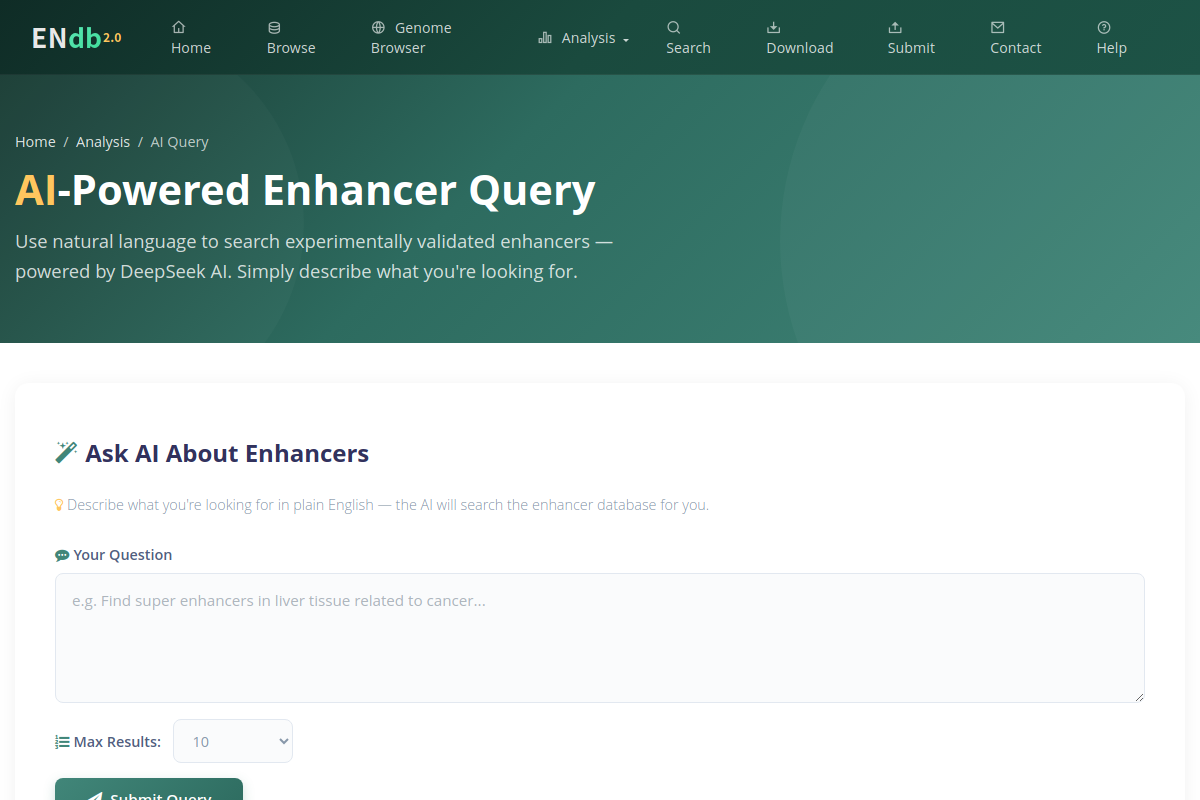
- AI-Powered Enhancer Query — Powered by DeepSeek AI, users can describe what they are looking for in natural language (e.g., "enhancers in brain tissue related to disease") and the AI automatically generates SQL to search the enhancer database. Clickable example queries help users get started quickly.
Pathway Enrichment Analysis:
AI-Powered Enhancer Query:
The Submit page allows researchers to contribute new experimentally validated enhancer data to ENdb. A structured form collects enhancer metadata, genomic coordinates, target genes, TFs, experimental methods, and publication references. Submitted data will be reviewed and integrated into the database.

The Download page provides the complete enhancer_main dataset for download as a tab-delimited text file. This includes all experimentally validated enhancers with their full metadata (coordinates, species, tissues, cell types, diseases, TFs, target genes, experimental methods, and publication references).

ENdb database contains 26 columns separated by tab:
| Column Name | Description |
|---|---|
| Enhancer_id | Unique enhancer identifier (e.g., E_00001) |
| Year | Publication year of the article |
| PMID | PubMed ID of the article |
| Title | Title of the article |
| Species | Species — Homo sapiens, Mus musculus, Danio rerio, Drosophila melanogaster, or Gallus gallus |
| Genome_Build | Reference genome version (hg19, hg38, mm10, danRer11, dm6, galGal6) |
| Chromosome | Chromosome number |
| Start_position | Start position of the enhancer |
| End_position | End position of the enhancer |
| TF | Transcription factor(s) binding the enhancer |
| Target_Gene | Target gene(s) regulated by the enhancer |
| Enhancer_type | Enhancer type — Enhancer or Super_Enhancer |
| Regulatory_State | Regulatory state (Active, Poised, etc.) |
| Condition | Experimental condition (Disease / Normal) |
| Disease_Name | Disease name(s) associated |
| MONDO | MONDO ontology ID for the disease |
| DOID | Disease Ontology ID |
| Tissue | Tissue(s) studied |
| Tissue_Ontology_ID | UBERON ontology ID for the tissue |
| Cell_Source | Source cell line or sample |
| CVCL_ID | Cellosaurus ID for the cell line |
| Cell_Type | Cell type(s) studied |
| Cell_Ontology_ID | CL ontology ID for the cell type |
| Experiment_Type | Category of experiments performed |
| High_Throughput_Method | High-throughput experimental methods |
| Low_Throughput_Method | Low-throughput experimental methods |
Development Environment
The current version of ENdb 2.0 is developed using MySQL 8.0.46 (mysql.com) and runs on an Ubuntu 24.04.1 LTS Linux-based Apache 2.4.58 Web server (apache.org). The server-side scripting is PHP 8.4.22 (php.net). We designed and built the interactive interface using Bootstrap v3.3.7 (v3.bootcss.com) and JQuery v2.1.1 (jquery.com). We used ECharts (echarts.baidu.com) and D3 (d3js.org) as graphical visualization frameworks, and JBrowse (jbrowse.org) is the genome browser framework. We recommend using a modern web browser that supports the HTML5 standard such as Firefox, Google Chrome, Safari, Opera or IE 9.0+ for the best display.
The ENdb database is freely available to the research community using the web link http://www.licpathway.net/ENdb. Users are not required to register or login to access features in the database.
Material Disclaimer
The materials and frameworks used by ENdb are shared by the network and do not contain intellectual property infringement. If there is any infringement, please write to us and we will change it in time.